Concepts - Computer Vision, Detection Transformer, Table Detection, Table Extraction, Optical Character Recognition (OCR)
Table extraction from documents using machine learning involves training algorithms to automatically identify and extract tables from a given document. This process can be challenging, as tables can come in various formats and layouts, and may be embedded within larger documents such as research papers, reports, or financial statements.
Streamlit App Video Demo
The app is not published due to copyright issues
Table of Contents
- Motivation
- Introduction to Table Extraction
- Pipeline
- OCR choices: Google Vision vs Pytesseract
- Notes on Table Extraction performance
- Examples of Table Extraction
- Conclusion
- References
Motivation
Table extraction from documents using machine learning involves training algorithms to automatically identify and extract tables from a given document. This process can be challenging, as tables can come in various formats and layouts, and may be embedded within larger documents such as research papers, reports, or financial statements.
To extract tables from documents, machine learning models are trained on large datasets of annotated tables. These datasets may include examples of tables in various formats and layouts. Algorithms may be trained using supervised learning methods, such as convolutional neural networks or support vector machines, to learn features that can distinguish between tables and non-table content.
Once the model is trained, the ideal case is to use the model to detect tables in a document and accurately parse the table into its constituent features such as headers, rows, and columns. This process is aided by the preprocessing of the document to remove noise and enhance resolution and contrast. The model then uses its learned features to identify whether the region contains a table or non-table content, and extracts the table accordingly.
Table extraction from documents using machine learning has numerous applications, including data analysis, document management, and information retrieval. It can save significant time and resources compared to manual extraction methods, especially for large or complex documents with multiple tables. However, the accuracy of table extraction can be affected by factors such as the quality and consistency of input data, as well as the complexity of the document layout.
Introduction to Table Extraction
A very accurate model has been developed by a team at Microsoft [1]. They trained their DETR (End-to-end Object Detection with Transformers) -based model on a very large dataset of approximately 1 million annotated tables. The original tables were scraped from the PubMed Central Open Access (PMCAO) database. The Microsoft team also formulated their own scoring criteria, Grid Table Similarity (GriTS), for assessing the accuracy of their model [2].
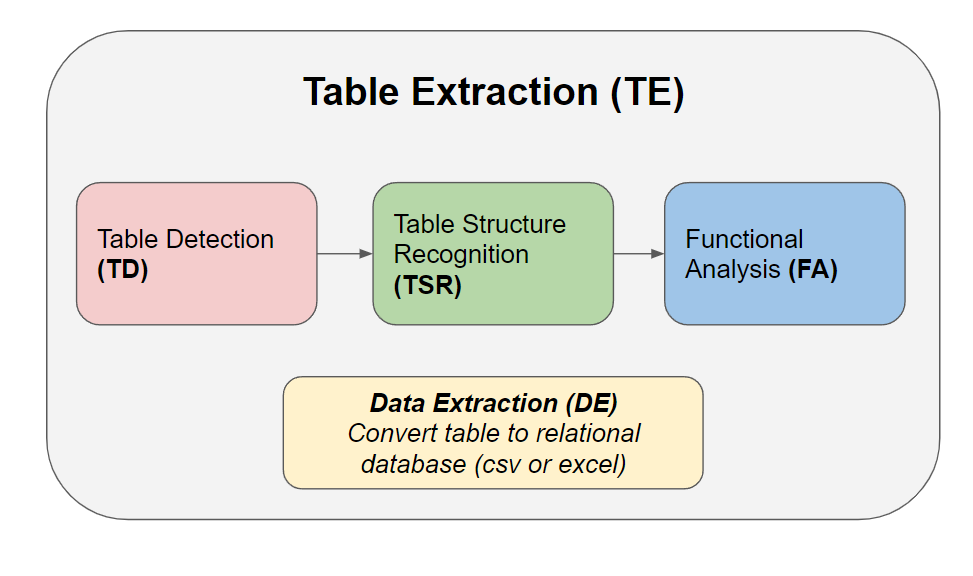
The entire table extraction process is best separated into these main steps:
Table Detection (TD)
- Finding the table in a page or document
Table Structure Recognition (TSR)
- Recognizing the fundamental features of a table such as rows and columns
Functional Analysis (FA)
- More advanced detection of functional features of the table such as column headers and project row headers
Data Extraction (DE)
- Extracting the content of the table into a relational database (e.g. dataframe, excel, or csv file)
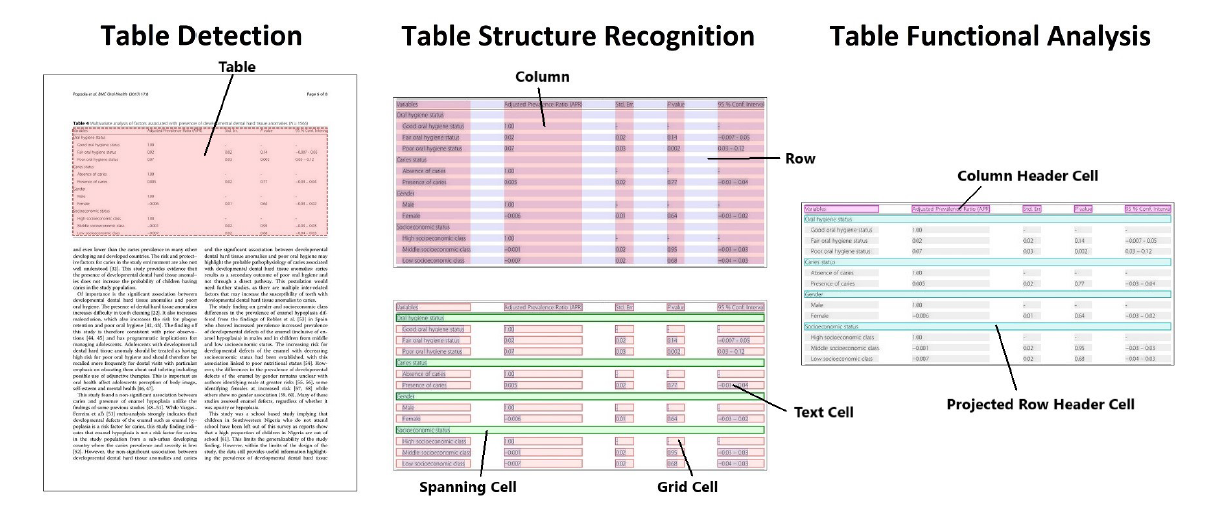
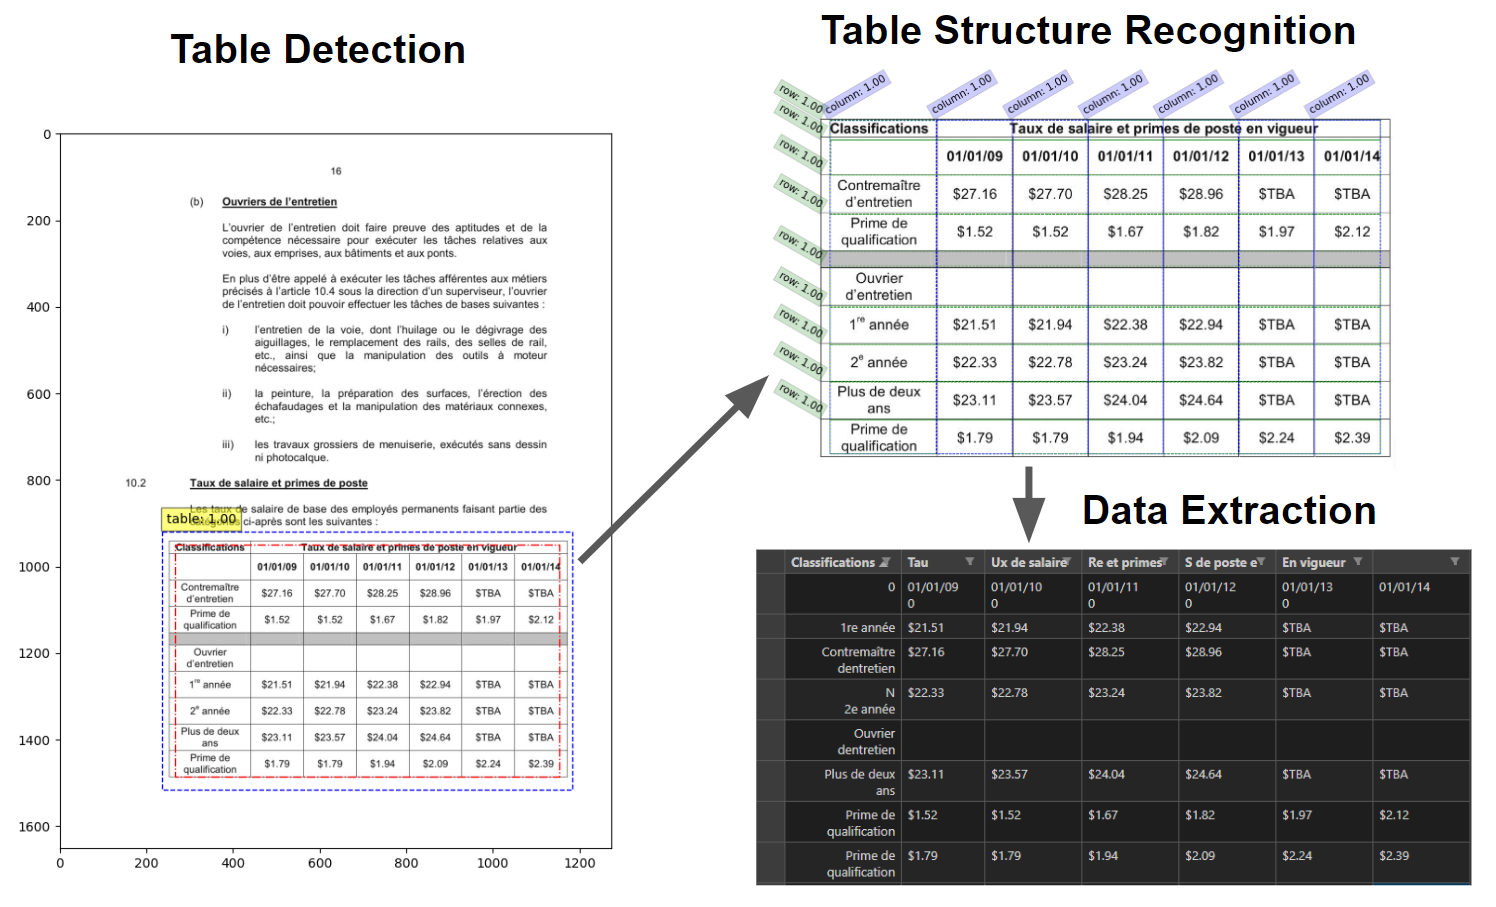
This figure is taken from reference [1]. Illustration of the first 3 subtasks of table extraction.
Example of table detection (TD) on a document page. Red box is drawn from the pretrained TD model. A GriTS score is given shown in the top left in yellow box. Table Structure Recognition (TSR) on the same table in the previous figure. With TSR and FA, the model can identify 5 distinct features of a table depicted in the figure below.
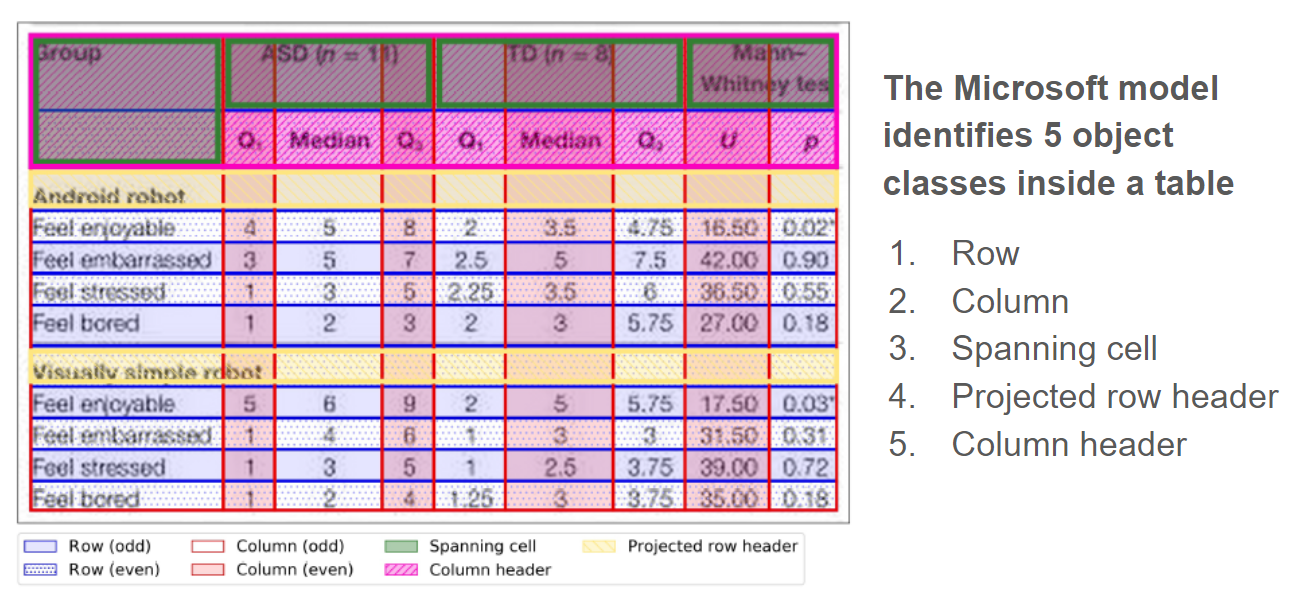
Fortunately, steps 1–3 can be done by the pre-trained Microsoft table transformer model available on Hugging Face. There’s currently no ML model for step 4, data extraction, so I have to build a custom solution.
Pipeline
The simplest way to extract data divide the raw table image into cells based on the rows and columns identified by TSR. For now, we will ignore the other features such as spanning cells and headers from FA. The entire table extraction process is illustrated in the flowchart below. Perhaps in the future, I will create a more advanced algorithm to apply the detected header features into a dataframe properly.
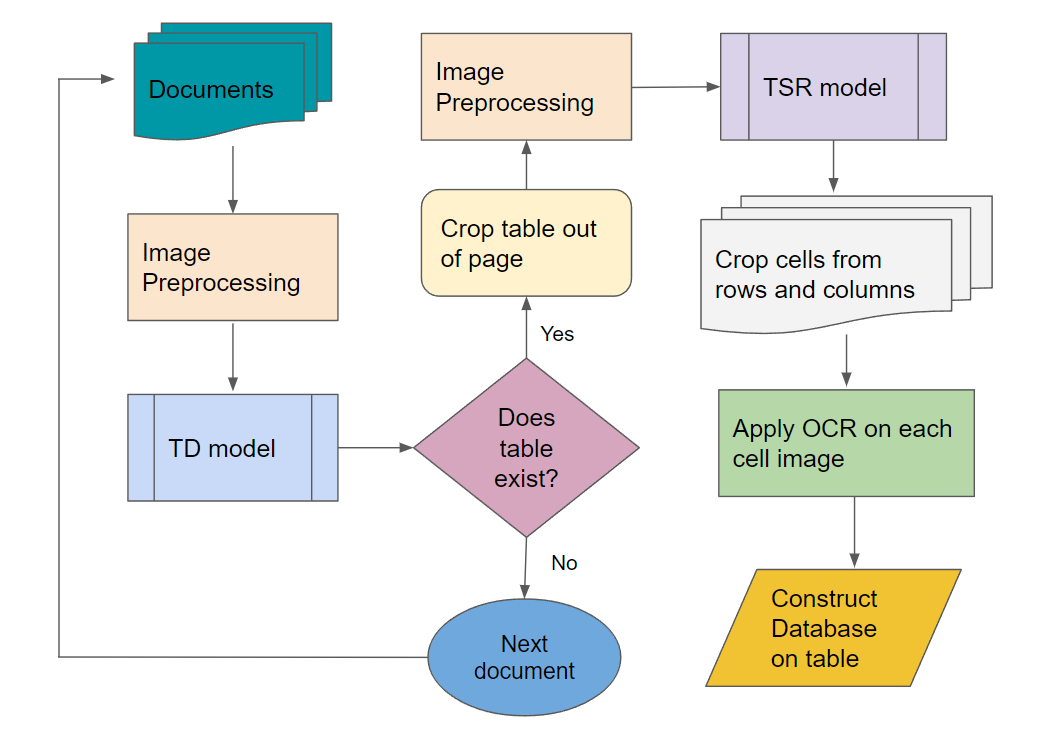
Pipeline for complete table extraction process.
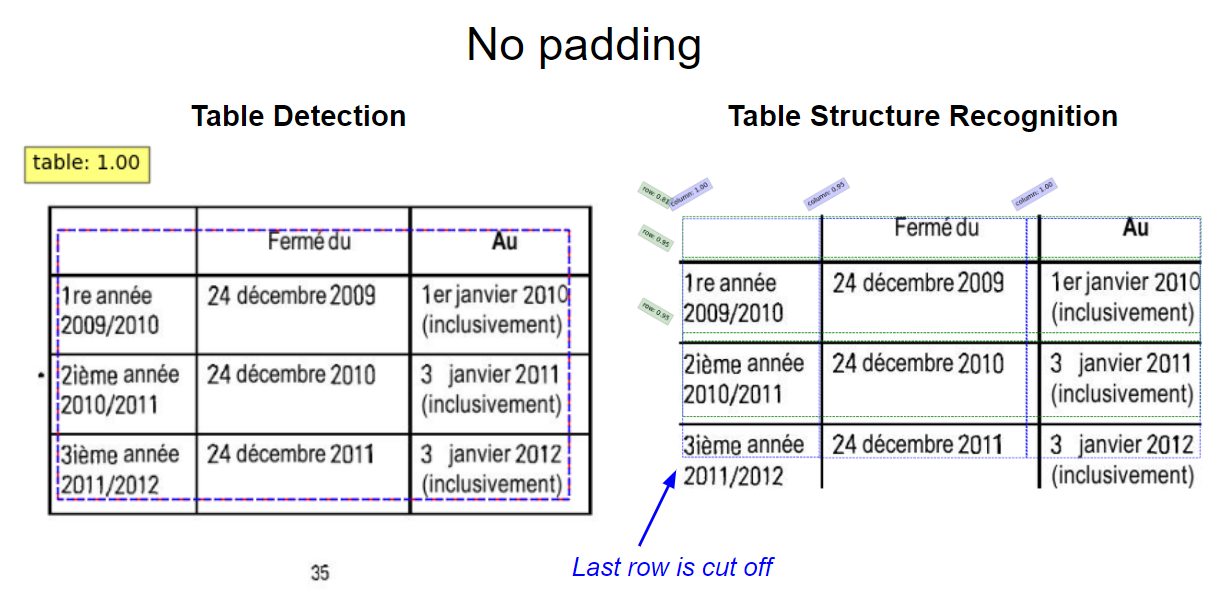
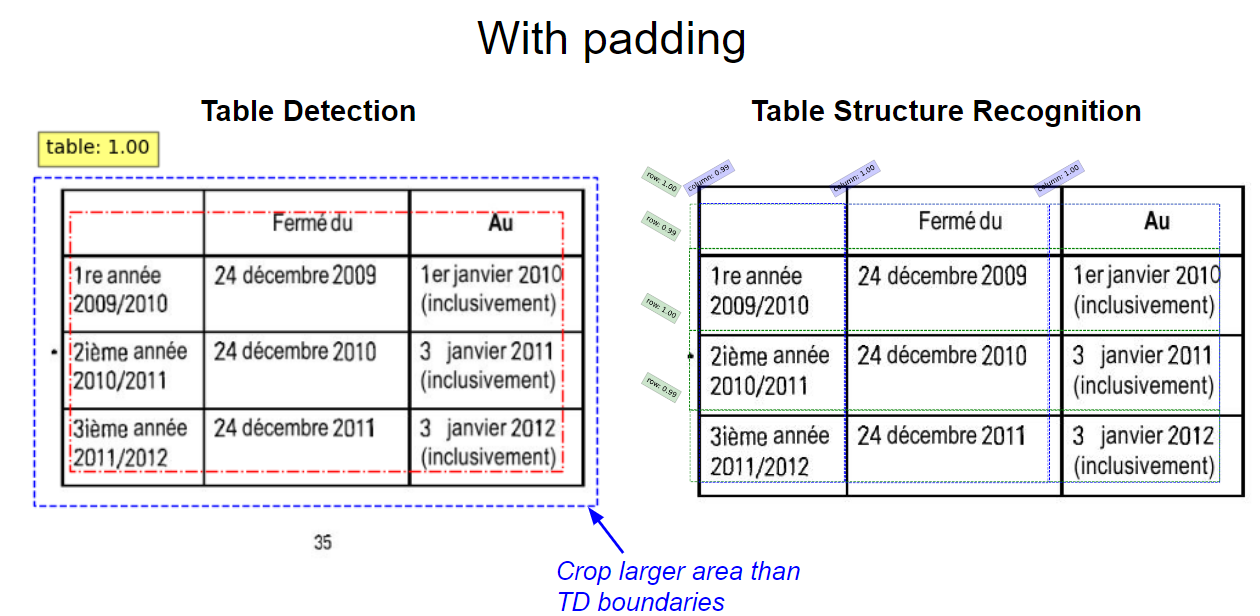
The image preprocessing steps are optional steps for enhancing the image quality before feeding them into the model. For instance, I found that adding padding to the cropping boundaries helps fully capture all row and column features, especially the ones at edge of the table.
OCR choices: Google Vision vs Pytesseract
The last few steps of the pipeline involve applying OCR to images to extract the content of the table cells. There are a variety of OCR tools one can use to perform the task. I decided to test out two common ones: Pytesseract, which is lightweight free, and open-source, and Google Vision OCR.
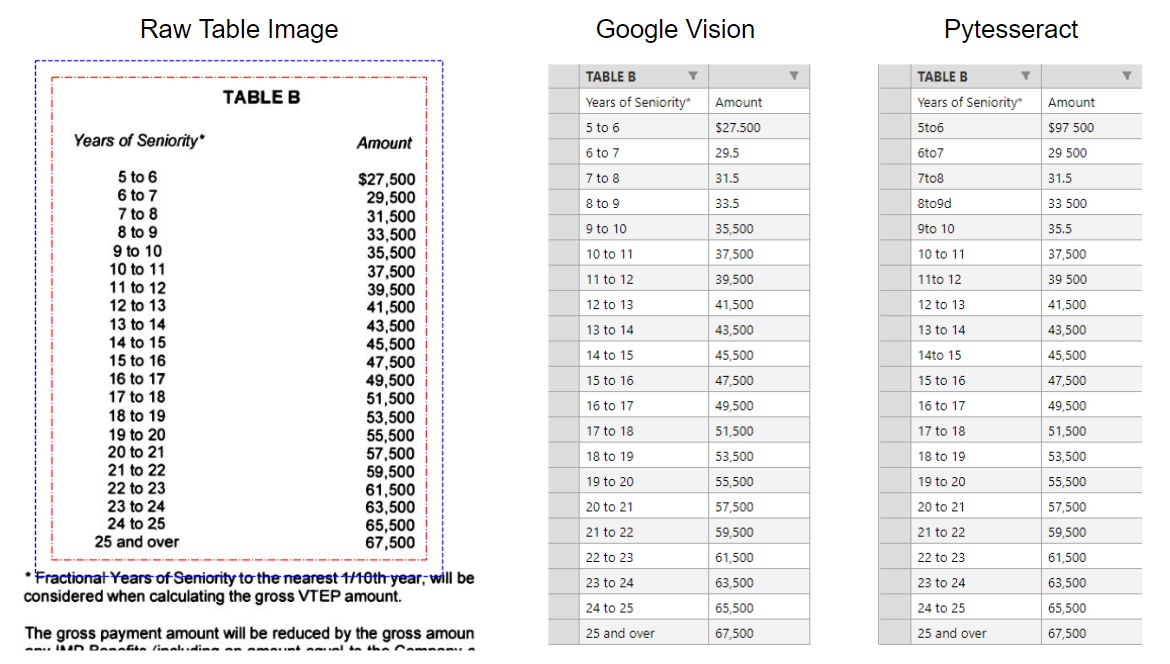
Notice the incorrect characters in the first few rows of PyTesseract.
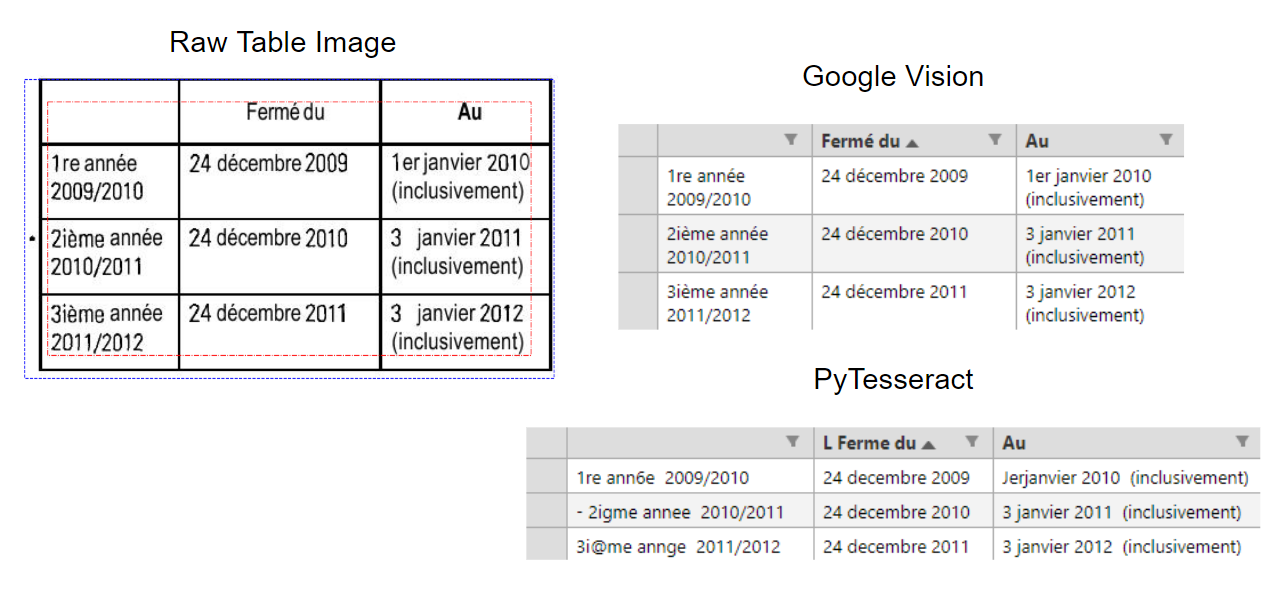
Google Vision was able to detect newline breaks and had flawless character recognition. PyTesseract shows a few mistakes and couldn’t recognize the accent on the e.
Google Vision OCR unanimously performs better. It does a better job of recognizing the spacing between characters and non-alphanumeric characters. However, if you plan on using table extraction a lot, Google Vision OCR is only free to a limit. I also notice that Google’s OCR takes 2–3 times longer to run. For the rest of this work, I choose to use Google Vision OCR as the primary tool for extracting tables.
Notes on Table Extraction performance
After running this program many times and observing the table extraction process, I notice a few problems that come up repeatedly.
Common failure points
- TD tends to draw bounding boxes too small, which cuts some important content in the table
- TD sometimes misses the header row, especially if the header is outside the table lines
- TSR sometimes creates overlapping bounding boxes.
- For borderless tables, TSR is accurate if the content is spaced evenly. But if the rows/columns are too close, it usually fails to detect the features correctly.
- For small font sizes, decimals and commas are indistinguishable by the OCR
- Here is a list of solutions that can be implemented in the pipeline. These can be part of the image preprocessing step before feeding the table image into the ML models.
Image preprocessing solutions
- Crop a slightly larger area than the TD bounding box
- Write a program that artificially draws the border of the table
- Scale the initial image larger to fix the row spacing problem
- Enhance images with poor resolution (especially after scaling) https://pillow.readthedocs.io/en/stable/index.html
Below are examples of how padding the cropping area after table detection can improve
Of course, the ultimate solution to improving performance is to further train the ML model for better detection accuracy. Hopefully, the Microsoft team is working on it and we get a better model in the future :p.
Examples of Table Extraction
Here are a few other samples to illustrate the performance of my table extractor. Each figure contains the screenshot images of the TD process, TSR process, and extracted data frame. Click on each image to get a better zoomed-in view. You can judge the accuracy yourself.
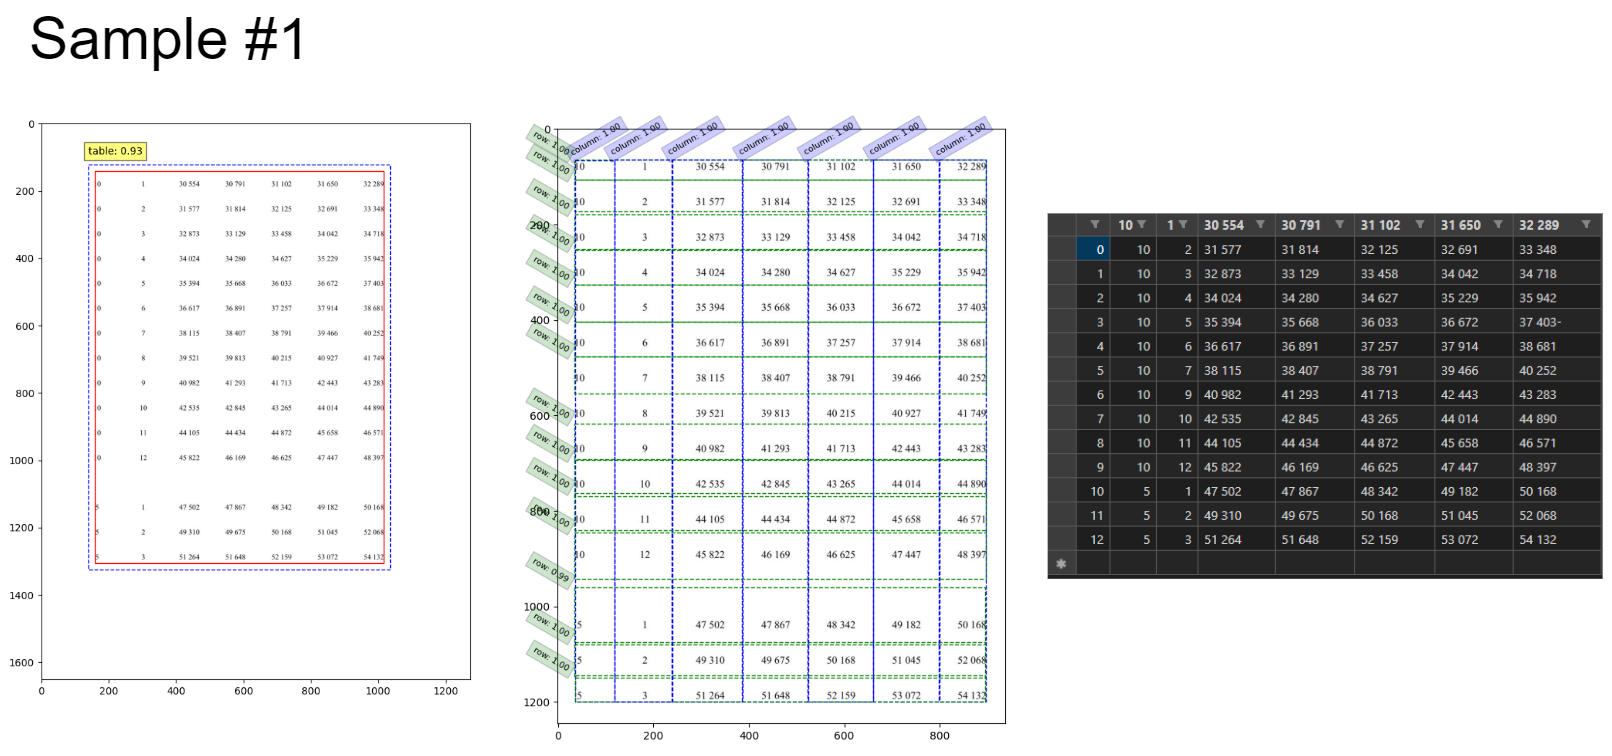
Borderless table with well-formatted spacing.
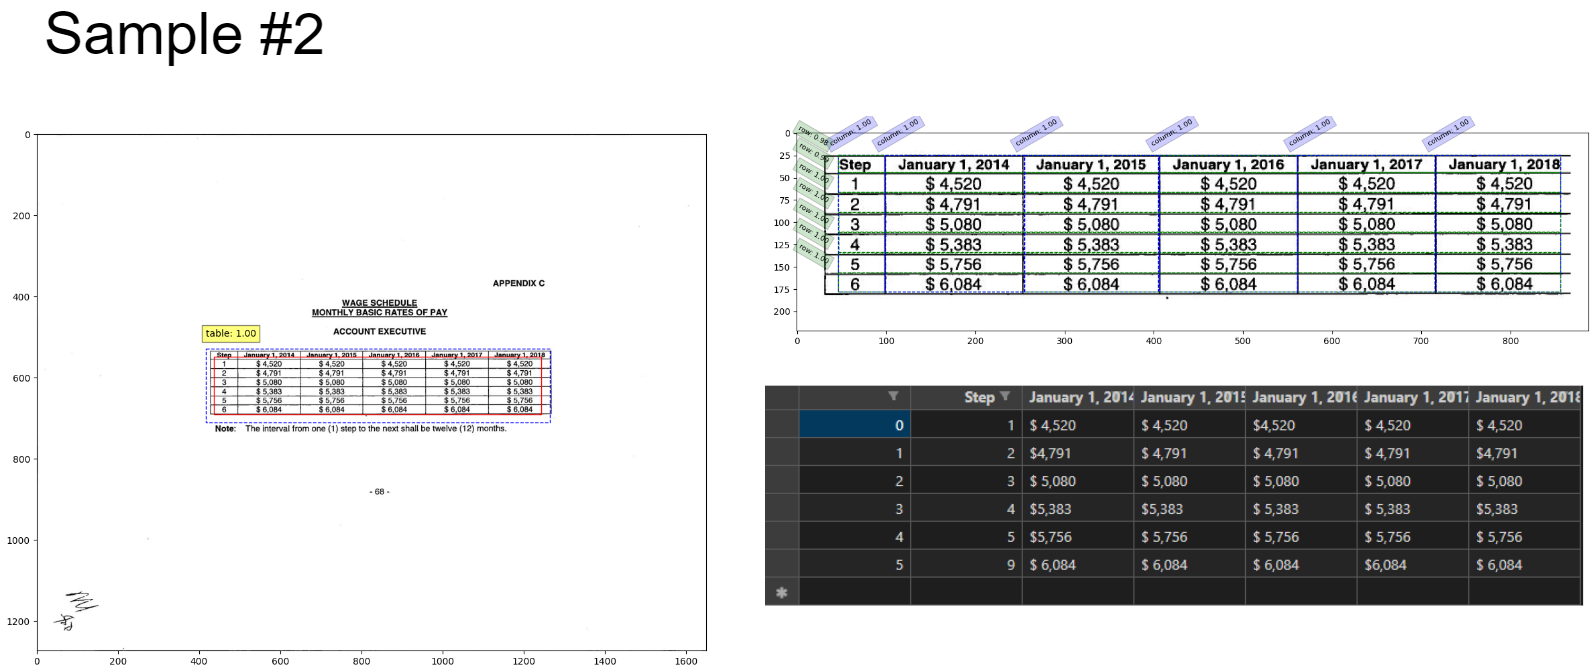
Bordered table of scheduled wages.
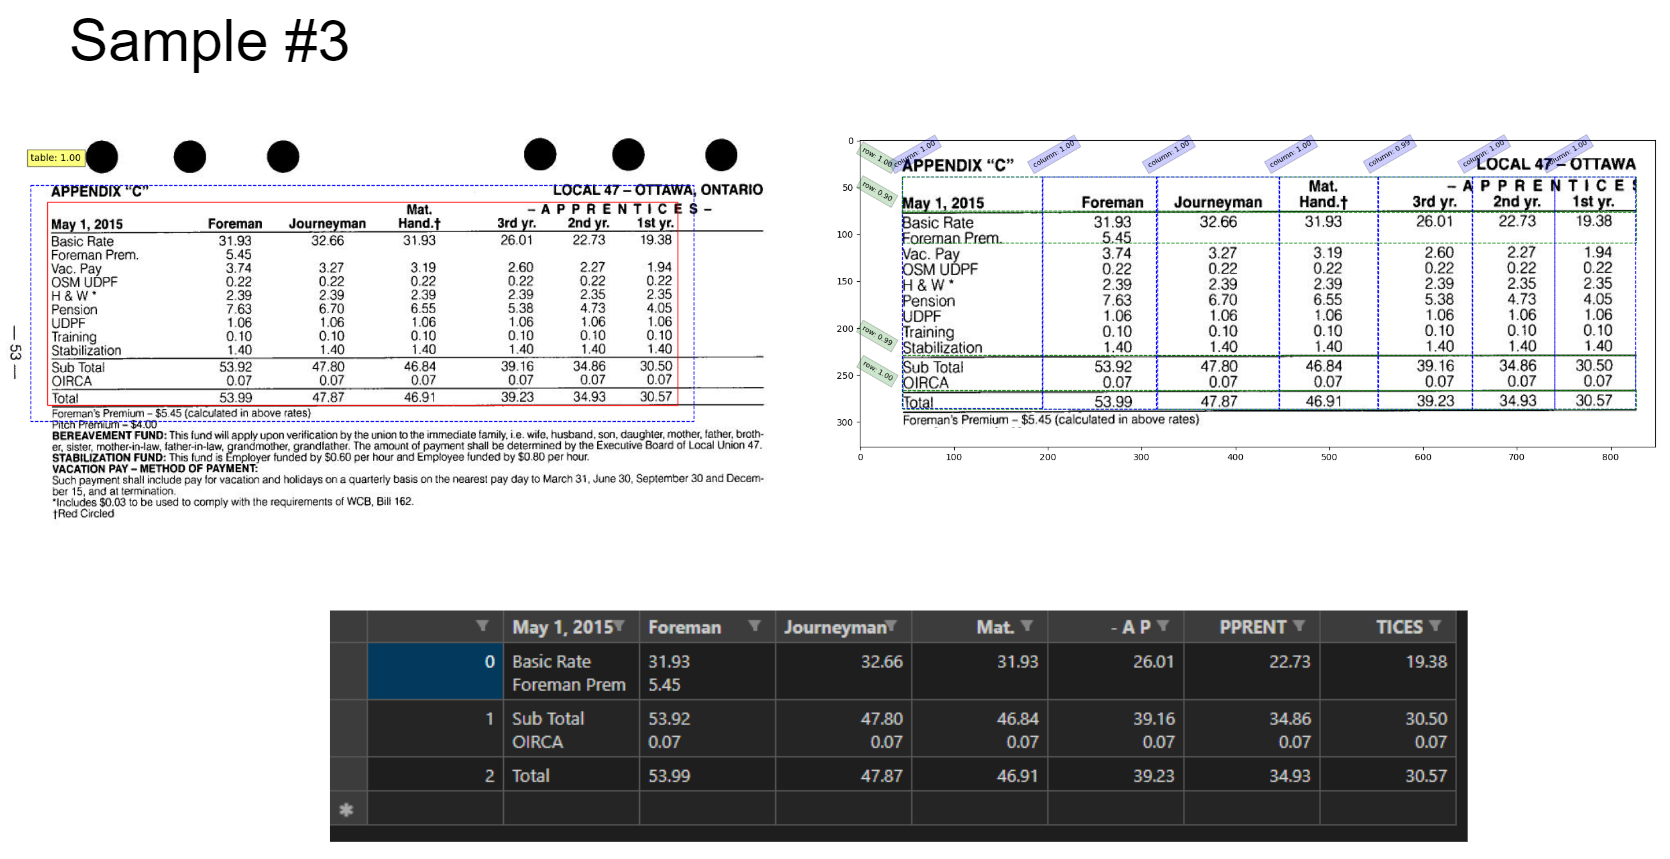
Table with horizontal lines to divide large sections. The individual rows in the middle sections were not detected.
Conclusion
I have successfully implemented Microsoft’s pre-trained table transformer model for complete table extraction (TE). The accuracy of my table extractor depends on a number of factors such as the quality of the image and the complexity of the table structure. For the most part, simple and well-formatted table structures can be extracted flawlessly into a csv file, even without borders. Future work may include:
- Implement header structures into dataframe
- Measure performance on well-known datasets such as ICDAR 2019
- Further training the model via transfer learning
- Deploying this model onto a web app -
done 2023-03-27
References
[1] PubTables-1M: Towards comprehensive table extraction from unstructured documents
[2] GriTS: Grid table similarity metric for table structure recognition
[3] CascadeTabNet: An approach for end-to-end table detection and structure recognition from image-based documents
